Cheerio Maps an experimental thing from stamen design with real data from zip realty.
Cheerio Maps is a view of housing data from http://www.ziprealty.com/ that we visualized in early 2010. The maps look at how the sizes, prices and ages of houses vary across the San Francisco Bay Area, and uses circles of different sizes to denote greater and lesser values. For example: Housing prices in San Francisco, specifically the Pacific Heights neighborhood!
There are three things about the project:
Thing 1: Colors
The colors are arbitrary—unlike the maps on Trulia Hindsight, there's not a consistent linear scale that lets you say that blue or green dots are pricier or older or smaller. This makes it easier to differentiate between dots that similar, but not identical, values. (It also looks really strange and cool). All dots that are (about) the same size have the same color, though. So all of the bluish dots in the image below are about the same price as one another, and the same goes for the pink ones. The fact that they're all mostly the same size means that this is a fairly homogeneously priced part of the Bay:
Whereas here, Piedmont (the larger dots in the upper right) clearly pop out as a neighborhood of pricey homes surrounded by less expensive properties:
Thing 2: Constancy
The dots never change size. So the very large yellow dot in the center of each of the following 6 views (in Tiburon is always the same house, regardless of zoom level:
 |  |
 |  |
 |  |
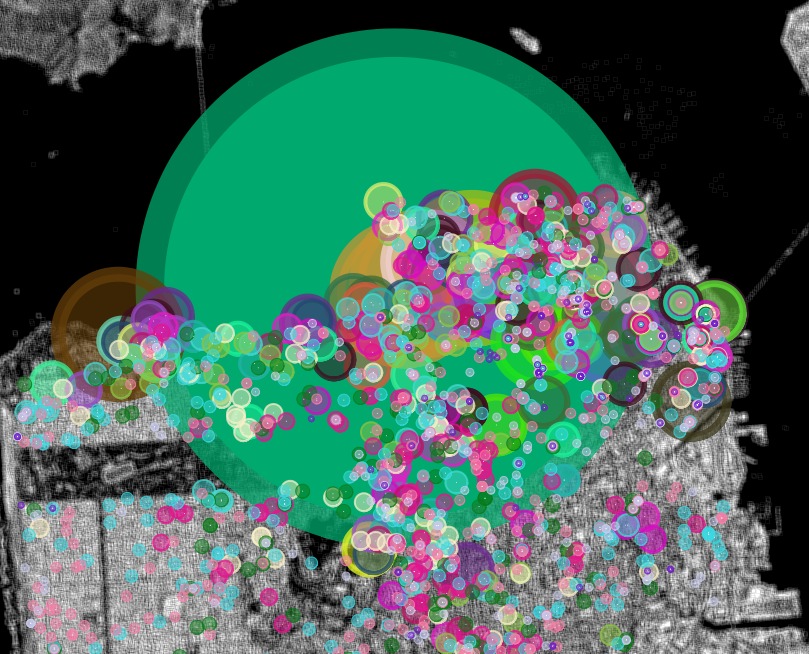
What this gets us is, primarily context. So for any given view, it's very apparent how varied the price (in this view) of homes are. In this case, at a local level, there's some variance (the yellow is twice the size of the purple) but the yellow is dominant for a while—until we zoom out to include San Francisco where the Green Giant overwhelms the scene (and speaks to the incredible economic disparity in that city).
Thing 3: The Bigness
The dots are bigger than they'd normally be in a more traditionally-looking structure like Polymaps' k-means clustering or Protovis' circle packing. This is partially to take a good look at the incredible disparity in real estate prices in the Bay Area. A view like the image below, of prices in El Grenada (near Moss Beach and Half Moon Bay) shows a very expensive house right in the same neighborhood as a group of much more moderately-priced homes.
Or the ways in which the mansions of Los Altos and [Stanford] ride hard against the cheaper homes of East Palo Alto:
Those overlapping concentric circles, with multiple places for sale at a single address? Those are condominiums in downtown San Francisco; and the wider the range of colors and sizes, the more diverse (financially) a building you're looking at:
And So
There's more; these views can be also sliced by the age of the property as well as the size of the unit compared to the size of the property, which allow for their own kinds of insights. And dots.
sharks on demand, courtesy cal henderson (but please blame matt jones)